If you haven’t setup your Raspberry Pi 4 with EVE, please go through Part 3 first.
We assume that the setup in Part 3 with the Raspberry Pi 4 is up and running.
System Architecture Design
We will use InfluxData’s InfluxDB v2
as a Time-Series Database (TSDB) to store metrics from our emulated EVE device.
Since we are in an emulated state at the moment and haven’t deployed any
EVE devices (e.g. Raspberry Pis) in our network, we will consider our
host machine as a system where:
Our TSDB runs and accepts information from EVE devices in the network
Provides a User Interface to observe the metrics
We will deploy
InfluxData’s Telegraf Monitoring Agent
as a pod on our emulated EVE device and set some configuration that will
provide us CPU usage metrics as well as memory consumption metrics.
These metrics are sent back to our TSDB where a user can observe them on a
Dashboard and query these metrics for further analyses.
Deployment
NOTE: We will not be doing a complete secure (TLS/SSL) setup here
InfluxDB v2.0
Since we already have docker on our host machine, let us setup the TSDB on it.
$ docker run --name=influxdbV2 -p 8086:8086 influxdb:2.0.7
This should be able to run InfluxDB v2.0.7 on the host machine and the port 8086
should be available for the TSDB to ingest any incoming metrics sent to it.
Open a browser and visit http://localhost:8086 which will provide you the UI for
InfluxDB v2. Click on Get Started
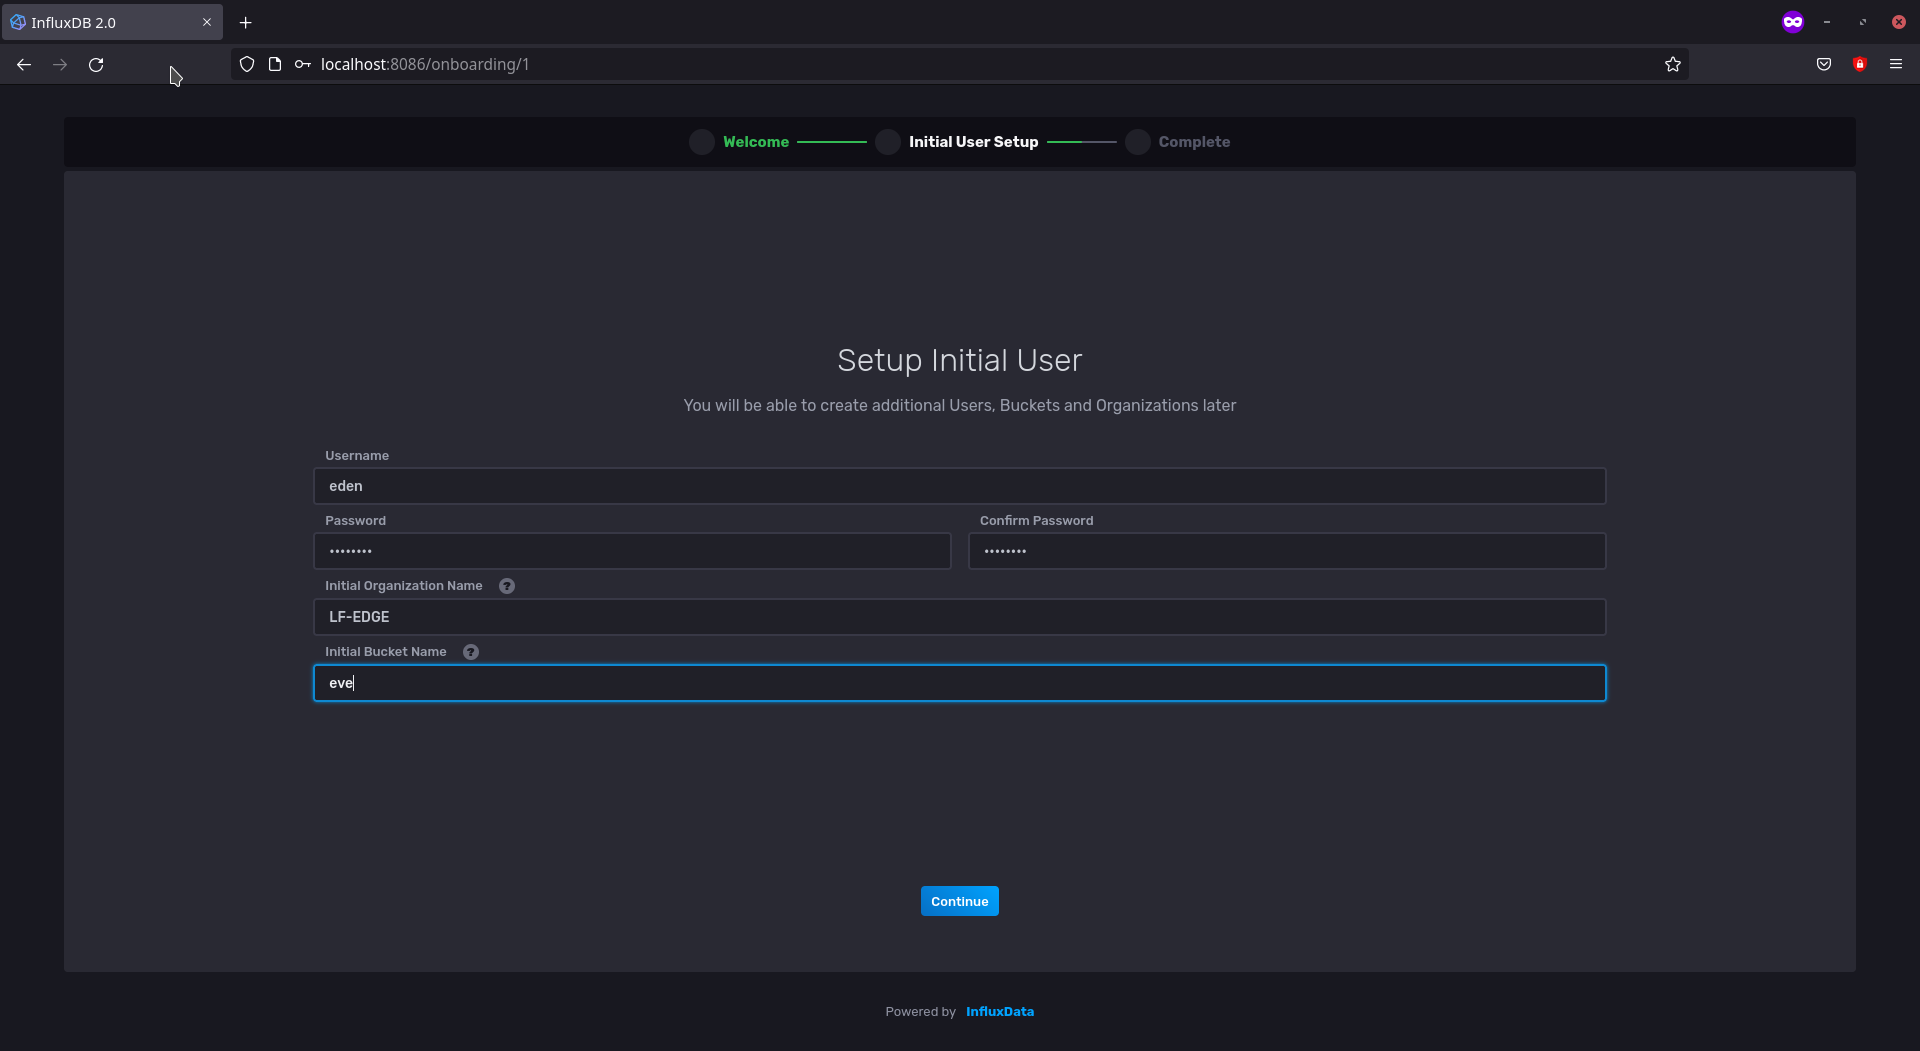
Let’s setup our InfluxDB v2 with the following information:
Username: edenPassword: influxdbOrganization: LF-EDGEBucket Name: eve
InfluxDB v2 Initial Configuration UI
Click Continue
Click on Configure Later for the next step.
We have now configured our InfluxDB v2 with a user eden under the Organization
LF-EDGE and a bucket called eve to store any metrics dedicated for it.
Telegraf
telegraf requires a configuration file in TOML to be able to acquire and push
information to our TSDB. It provides a wide range of plugins but for this tutorial
we will focus on the easiest ones.
The eden/data/telegraf/telegraf.conf file for our case looks like the following:
[agent]interval="2s"round_interval=truemetric_batch_size=1000metric_buffer_limit=10000collection_jitter="0s"flush_interval="10s"flush_jitter="0s"precision=""debug=truequiet=falseomit_hostname=false### INPUT PLUGINS ###[[inputs.cpu]]### OUTPUT PLUGINS ###[[outputs.influxdb_v2]]# REMEMBER TO CHANGE INPUTS HERE BEFORE DEPLOYMENTurls=["http://YOUR_IP_ADDRESS:8086"]token="YOUR_INFLUXDBV2_GENERATED_TOKEN_HERE"organization="LF-EDGE"bucket="eve"
Adapt the Configuration file where the urls should point to the host’s IP Address.
For an InfluxDB v2 Token we do the following:
Head to Data in our InfluxDB UI on the left-side column
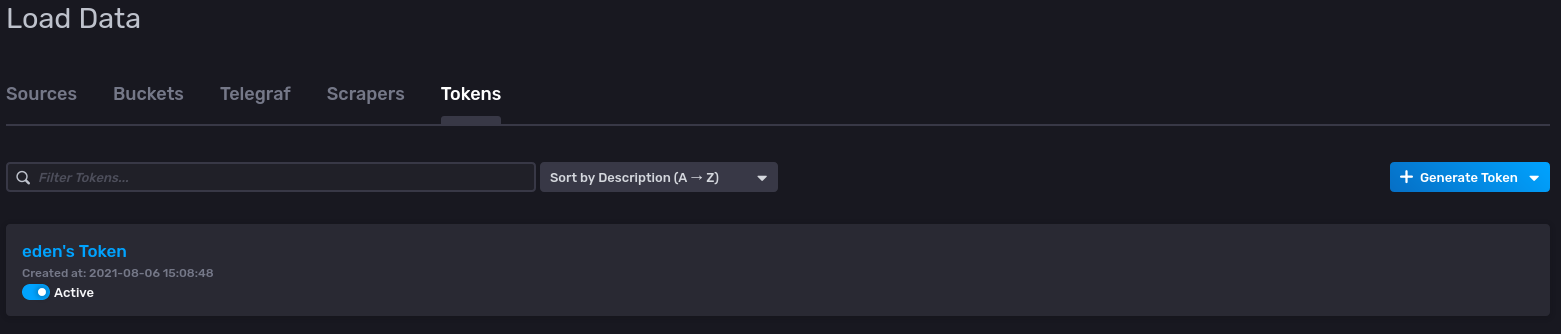
We click on the Tokens Header in the UI where you will see the following:
Generated Token for user eden in InfluxDBV2 UI
Click on eden's Token and copy the token into the configuration file for the
output plugin
We are done with telegraf configuration! we will let eden download telegraf's
docker image from Docker Hub for us.
Deployment
Deploy the telegraf Pod on the Pi using:
./eden pod deploy --name=eve_pi_telegraf docker://telegraf --mount=src=./data/telegraf,dst=/etc/telegraf/
Check status of the pod using:
./eden pod ps
After a while the pod should be deployed! let’s check the status first:
./eden pod ps
NAME		    IMAGE			        UUID					              INTERNAL	EXTERNAL	MEMORY	STATE(ADAM)	LAST_STATE(EVE)
eve_pi_telegraf	library/telegraf:latest	f0e61dda-8dda-4944-85a3-4b52b736cc88	10.11.12.2	-		0 B/0 B	IN_CONFIG	RUNNING
Great time to head on to InfluxDB’s Dashboard for some fancy graphs!
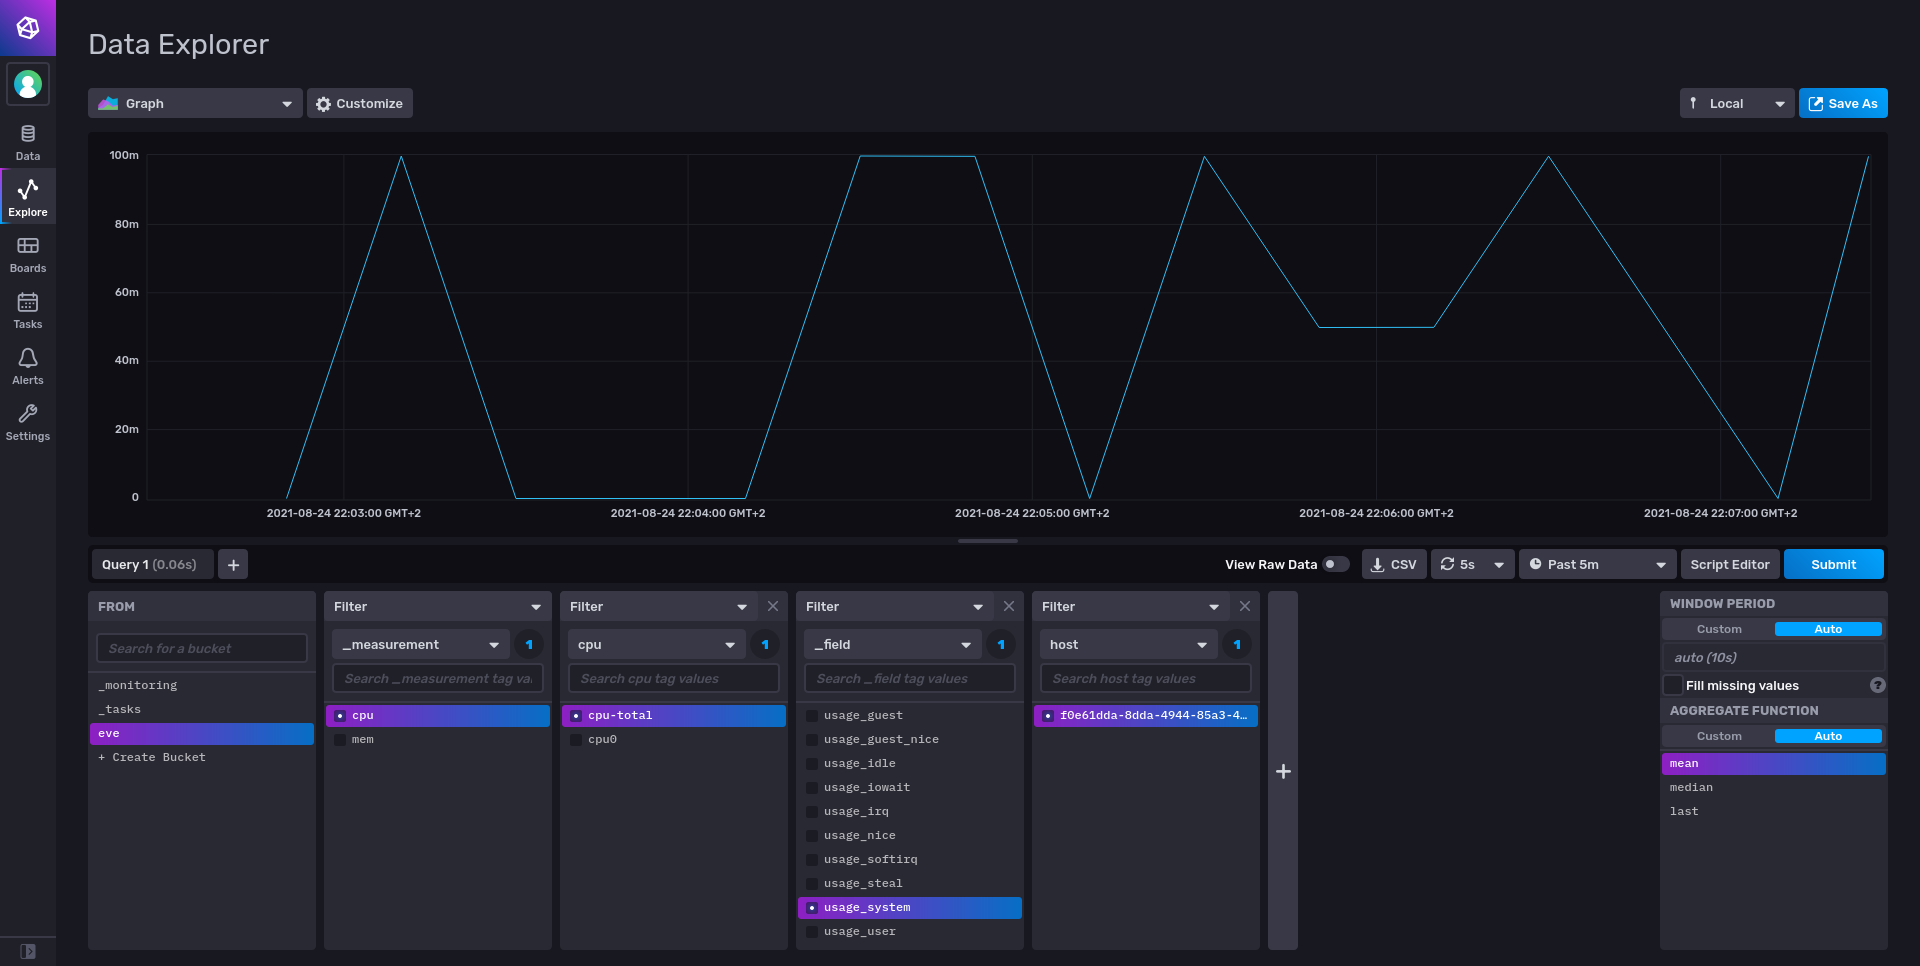
CPU Usage Dashboard
System Usage Dashboard for RPi4 EVE Device
As you can see we have a tag which matches the UUID of the Pod (see ./eden pod ps)
Logs and Troubleshooting
If you want to see the working logs of telegraf
./eden pod logs eve_pi_telegraf --fields=app --format=json
Redeploy nginx for Fun
You can deploy the nginx pod from our previous tutorial as way to simulate workload on your edge device
./eden pod deploy --name=eve_pi_nginx docker://nginx -p 8027:80 --mount=src=./data/helloeve,dst=/usr/share/nginx/html
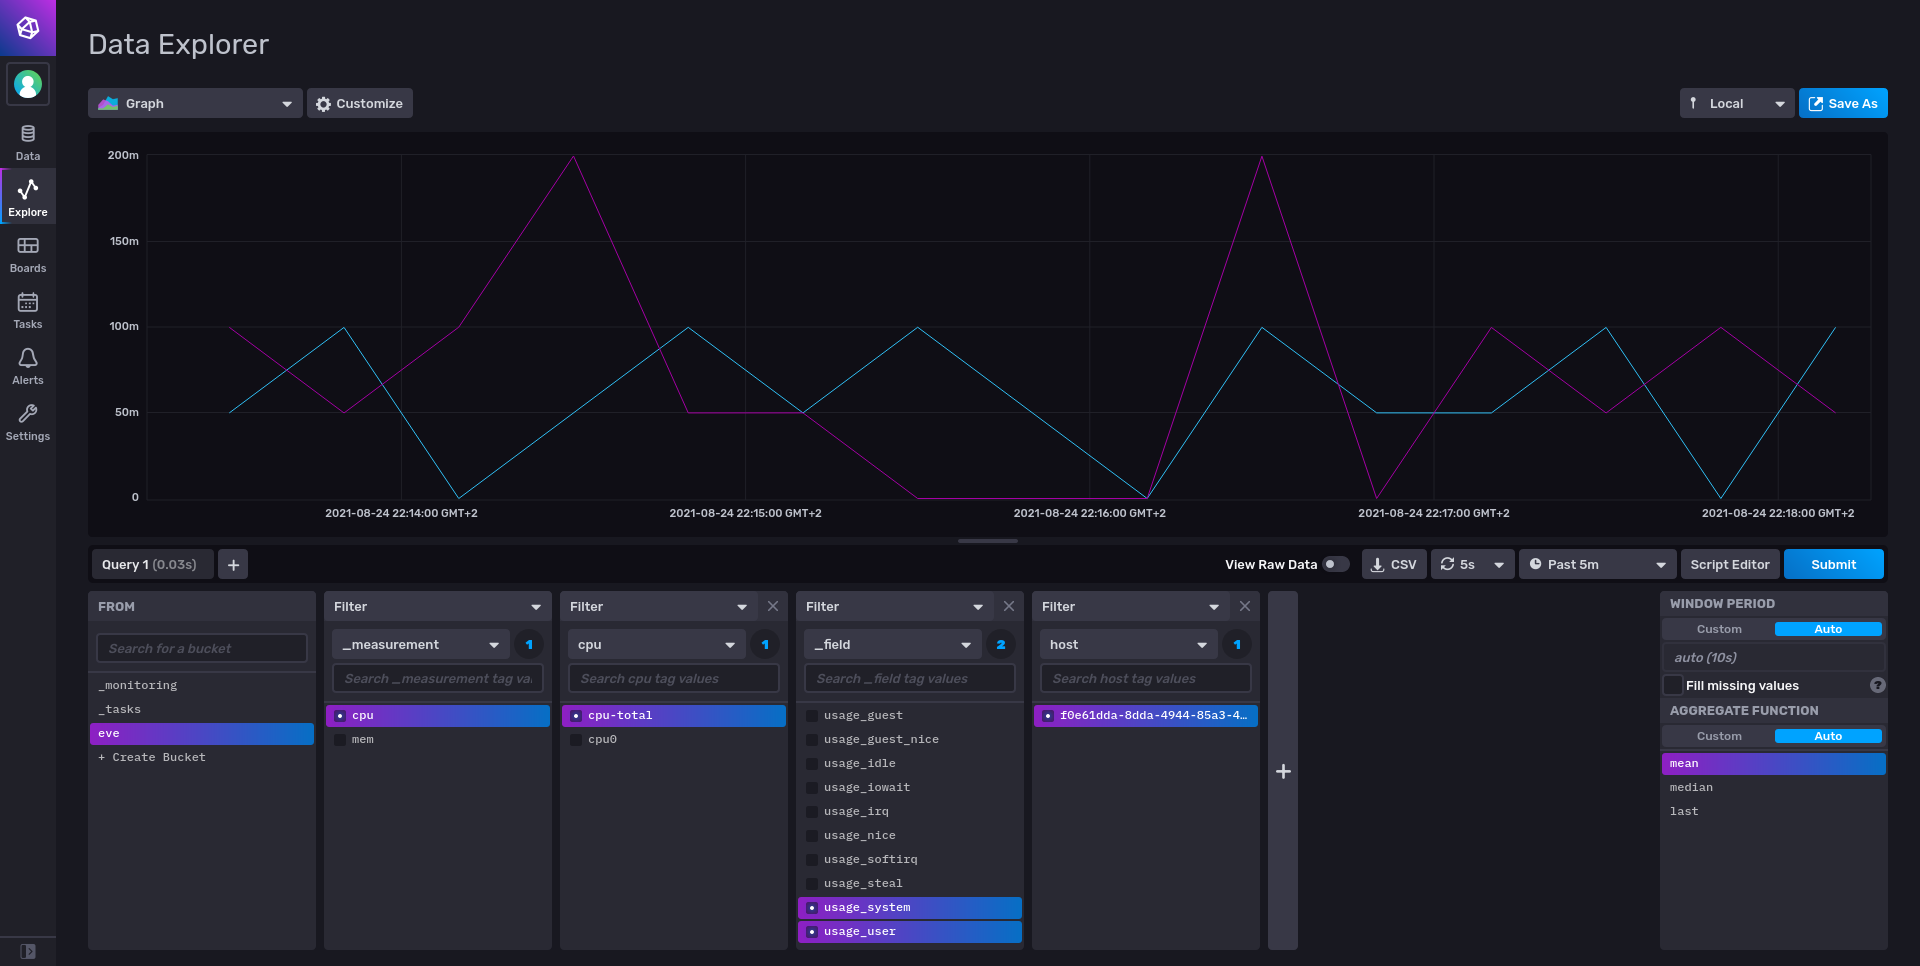
And you can Request the nginx pod like we did previously!
curl http://localhost:8027
After some curl commands consecutively you can observe the CPU System and User Usage for the EVE Device