Creating your IoT Node and Edge prototype with InfluxDB, Telegraf and Docker

Scenario
A micro-controller connected to a digital sensor (IoT Node) will publish information to an MQTT broker running on an IoT Edge Device. The Edge Device and the IoT Node are connected to each other using WLAN. The Edge Device also has a Database that collects all the IoT Node data via the MQTT Broker.
Requirements
Hardware
ESP32 Microcontroller
LSM9DS0 9-DoF Accelerometer + Gyroscope + Magnetometer Sensor from Adafruit (Any other digital sensor of your choice will work too)
Raspberry Pi 4 Model B (Any other Raspberry Pi Model should work too)
Software
Raspbian Buster Lite OS for Raspberry Pi
Arduino IDE 1.8 or later to program the ESP32
Miscellaneous
A WLAN router with internet connection to create a WLAN network between your IoT Node and IoT Edge Device as well as download Docker and other tools on the Pi.
IoT Node
We will write an Arduino Sketch to program the ESP32 to do the following tasks:
Setup the ESP32 to connect to the WLAN Router and an MQTT Broker
Initialize the LM9DS0 sensor to send data via the I2C interface
Structure the data from the sensor into Line Protocol Strings without timestamps
Publish the data to their respective MQTT topics every second
Connecting the LM9DS0 Sensor to the ESP32
In order to use the I2C interface the following pins of the sensor should be connected to the ESP32:
| LM9DS0 Pins | ESP32 Pins |
|---|---|
| 3V3 | 3V3 |
| GND | GND |
| SCL | GPIO22 |
| SDA | GPIO21 |
A pin map diagram is available on the Arduino ESP32’s GitHub Repository for reference.
Arduino Libraries and Sketch
Sketch mentioned below is tested for Arduino IDE 1.8.9
Make sure to download the arduino-esp32 using the Arduino IDE Boards Manager. (Installation Guide: here)
For the LSM9DS0 Sensor, download the respective libraries by following the steps here. Make sure to Download both, the Adafruit LSM9DS0 and, the Adafruit Unified Sensor libraries.
Here is the Sketch. There are certain details you will have to change according to you network settings. These changes like ssid, password of your WLAN Router, and mqtt_broker_address can be configured in the IDE easily.
Once the IoT Edge device is ready we can write the IP address of in the mqtt_broker_address of the Sketch, reprogram the IoT Node and the data will be published to the broker on the Edge accordingly.
The line protocol strings for each sensor measurement looks like the following:
<measurement_name> <field1>=<field1val>,<field2>=<field2val>...
For example, the temperature measurement in Line Protocol Format looks like:
temperature temp=24
Notice, we are not sending data with any tags or timestamps. We will add relevant tags on the IoT Edge device using the power of Telegraf. For timestamps, one can add code to insert epoch timestamps using an NTP Client on the ESP32. In our case, the timestamps will be added by InfluxDB.
Our goal, like many IoT applications is to keep the payload as light as possible.
IoT Edge
Time to brush that thick layer of dust off your Raspberry Pi ! For this post, we use a Raspberry Pi 4 Model B with 2GB RAM. However a Raspberry Pi 3 should work just fine.
Initial Configuration of Pi
Here are some quick steps to follow to setup the Pi:
- Download Raspbian Buster Lite
- Flash the OS Image on to an SD Card (Use balenaEtcher for Windows)
- Connect Pi to a screen and a keyboard and power it up
Setting up WLAN Connection for the Pi
Edit the wpa_supplicant.conf file by using the following in Pi’s terminal:
sudo nano /etc/wpa_supplicant/wpa_supplicant.conf
Add the following settings into the file:
country=DE
ctrl_interface=DIR=/var/run/wpa_supplicant GROUP=netdev
update_config=1
network={
    scan_ssid=1
    ssid="<YOUR_WLAN_SSID>"
    psk="<YOUR_PASSWORD>"
}
CTRL + O and then CTRL+X to write the content in the file.
Check if your Kernel is blocking the WLAN interface on the Pi using:
sudo rfkill list
If your WLAN interface is Soft Blocked, i.e. Soft blocked: yes then unblock it using:
sudo rfkill unblock wifi
Change the /etc/network/interfaces file to the following:
auto lo
iface lo inet loopbackauto wlan0
allow-hotplug wlan0
iface wlan0 inet manual
wpa-roam /etc/wpa_supplicant/wpa_supplicant.conf
This configuration will make your wlan0 interface ask your WLAN router for an IP address once the interface itself is up. Finally, do the following to wake the wlan0 interface up:
sudo ifdown wlan0
sudo ifup wlan0
This should make the Pi obtain an IP address from the router and it should be connected to the network. To check your IP address simply do:
ifconfig wlan0
To check connectivity to the Internet ping Google’s DNS Server:
ping 8.8.8.8
Installing Docker on Pi
Instead of installing each software tool on the Pi individually, we will install and use Docker to do the heaving lifting for us and hence saving a lot of time.
To install docker on the Pi perform:
curl -sSL https://get.docker.com | sh
This should install docker Community Edition on the Pi. During the time of writing this post the version installed on the Pi was:
docker --version
19.03.8 build afac686
Make sure you can run Docker on the Pi with sudo privileges but adding:
sudo usermod -aG docker pi
Logout of the Pi by typing exit and login back.
To test Docker on the Pi, run:
docker run hello-world
InfluxDB using Docker on Pi
We will spin docker images on the Pi individually for each tool. For InfluxDB 1.7.x on the Pi:
docker run --name piflux \
           -d
           -p 8083:8083 \
           -p 8086:8086 \
           -v influxdb:/var/lib/influxdb
           influxdb
This should bring up an InfluxDB 1.7.x container running in detached mode under the name piflux . To check if the DB is reachable use curl on the Pi:
curl -i -XGET http://localhost:8086/ping
It might also be worth performing the same action with a computer connected to the same WLAN network as that of the Pi with the IP address of the Pi as follows:
curl -i -XGET http://<PI_IP_ADDRESS>:8086/ping
Mosquitto MQTT Broker on Pi
Create a directory to store the Mosquitto broker’s configuration:
mkdir mosquitto/
mkdir mosquitto/config
touch mosquitto/config/mosquitto.conf
The configuration is a default one to make the broker persistent. The configuration file is as follows:
persistence true
persistence_location /mosquitto/data/
log_data file /mosquitto/log/mosquitto.log
Spin up a container for Mosquitto broker as follows:
docker run --name pibroker \
           -d
           -p 1883:1883
           -p 9001:9001
           -v $(pwd)/mosquitto/config/mosquitto.conf:/mosquitto/config/mosquitto.conf
            eclipse-mosquitto
This should make an MQTT Broker ready on the Pi. You can now update the mqtt_broker_address in the Arduino Sketch above and subscribe to anyone of the topics via a GUI based MQTT client on the computer in the network so see published data on the broker.
Telegraf on Pi
Telegraf is the real Swiss Army Knife here which will do the following tasks for us:
- Connect to the MQTT Broker on the Pi and Insert the data into InfluxDB
- Will add the
SENSOR_IDin the MQTT topic as ataginto InfluxDB.
Let’s create a sample config for MQTT as an input to Telegraf and InfluxDB as Output using Docker:
docker run --rm telegraf -sample-config \
                -input-filter mqtt_consumer \
                -output-filter influxdb > telegraf.conf
This should create a telegraf.conf in the working directory on the Pi.
Let’s organize a bit:
mkdir telegraf/
mv telegraf.conf telegraf/
Telegraf Configuration
The configuration file that is needed is as follows:
[agent]
 interval = "10s"
 round_interval = true
 metric_batch_size = 1000
 metric_buffer_limit = 10000
 collection_jitter = "0s"
 flush_interval = "10s"
 flush_jitter = "0s"
 precision = ""
 quiet = false
 hostname = ""
 omit_hostname = false

 [[outputs.influxdb]]
# Configuration for InfluxDB urls = ["http://127.0.0.1:8086"]
 database = "edge" # Name it whatever you like
 skip_database_creation = false[[processors.regex]]
[[processors.regex.tags]]
# The Magic Section key = "topic"
 pattern = ".*/(.*)/.*"
 replacement = "${1}"
 result_key = "sensorID"

 [[inputs.mqtt_consumer]]
# Configuration for MQTT Broker  servers = ["tcp://127.0.0.1:1883"]
  topics = [
    "IOT/+/acc",
    "IOT/+/mag",
    "IOT/+/gyro",
    "IOT/+/temp"
  ]
  topic_tag = "topic"
  qos = 0
  client_id = "telegraf_client"
  data_format = "influx"
We can skip the [agent] part of the configuration and keep it the same as the default values.
The [[outputs.influxdb]] will tell Telegraf which InfluxDB it needs to insert the incoming data into, and under what database name should the values be stored (here edge)
The [[inputs.mqtt_consumer]] is the input plugin which will connect to a dedicated MQTT Broker mentioned in the servers list. The topics list will take care of which topics to subscribe to. Notice, we use the MQTT topic wildcard + to subscribe to all the IoT Node data irrespective of what the sensor’s ID is. Since the IoT Node sends data in Line Protocol Strings, we use the incoming data_format = "influx". Additionally, each measurement will be stored with a tag called topic where the respective data’s MQTT topic will be stored a string.
In our case the IoT Node publishes data under for the following topic structure:
IOT/<SENSOR_ID>/acc
IOT/<SENSOR_ID>/mag
IOT/<SENSOR_ID>/gyro
IOT/<SENSOR_ID>/temp
Once the application needs to scale, the number of unique sensor IDs increase and each measurement needs to be tagged for further processing and easily making queries like:
SELECT temp FROM temperature WHERE sensorID="sensorX" LIMIT 100
We let the [[processors.regex]] figure out what is the sensor ID from each message. We already know that the [[inputs.mqtt_consumer]] will store a tag called topic for each published measurement. We can leverage this and use a regular expression to tell Telegraf which string in the MQTT topic is the sensor ID.
The pattern is .*/(.*)/.* since we only care about the 2nd MQTT topic level which is our Sensor ID. The () will extract the sensor ID and store it as tag with the name sensorID . Hence, the following configuration:
[[processors.regex]]
[[processors.regex.tags]]
# The Magic Sectionkey = "topic"
 pattern = ".*/(.*)/.*"
 replacement = "${1}"
 result_key = "sensorID"
Bringing it all Together
Time to spin one last container! The telegraf container with out custom configuration is executed as follows:
docker run --name=pitelegraf \
           -d \
           --net=host \
           --restart=always
           -v $(pwd)/telegraf/telegraf.conf:/etc/telegraf/telegraf.conf:ro \
            telegraf
Once this container is up and run and the IoT Node is publishing data to the IoT Edge’s MQTT Broker, the data should be available on InfluxDB.
An easy way to check is to run Chronograf on the computer within the WLAN network.
Run the binary, and in the browser enter http://localhost:8888/
In Chronograf, go to configuration Tab on your left side and add a new connection with the IP Address of the IoT Edge’s InfluxDB.
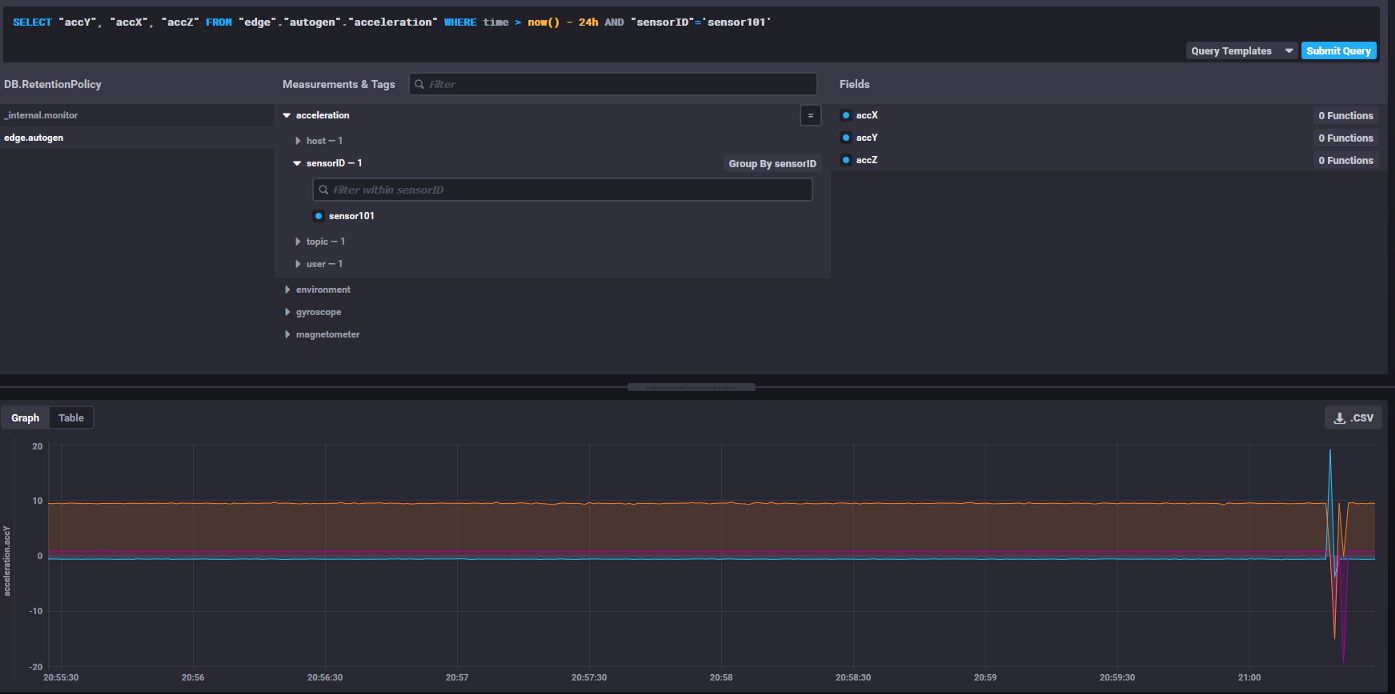
Connect to the DB and go the Explore Tab. Once there you should be able to see edge.autogen database and also the sensorID tag for every measurement

Chronograf displaying the InfluxDB Databases and Measurements with automatically created sensorID tag and visualization for them
Resources
A complete stack for the post can be now found as a GitHub Repository as a docker-compose.yml file tested a Raspberry Pi 4 Model B.