Observing Eve's CPU and Memory Consumption via Telegraf in QEMU - Part 2
In this tutorial we go through the step-by-step process of observing an EVE device’s CPU and Memory consumption in our previously generated QEMU Image on our Host
Prerequisites
Before going into this tutorial make sure to go through
Part 1 post. We need to have the same setup as mentioned
in the post. In this post, we try to replace the nginx pod deployed as
an example with something that can provide some form of usage observability
of our EVE device, albiet in an emulated environment.
System Architecture Design
We will use InfluxData’s InfluxDB v2 as a Time-Series Database (TSDB) to store metrics from our emulated EVE device.
Since we are in an emulated state at the moment and haven’t deployed any EVE devices (e.g. Raspberry Pis) in our network, we will consider our host machine as a system where:
- Our TSDB runs and accepts information from EVE devices in the network
- Provides a User Interface to observe the metrics
We will deploy InfluxData’s Telegraf Monitoring Agent as a pod on our emulated EVE device and set some configuration that will provide us CPU usage metrics as well as memory consumption metrics.
These metrics are sent back to our TSDB where a user can observe them on a Dashboard and query these metrics for further analyses.
Deployment
NOTE: We will not be doing a complete secure (TLS/SSL) setup here
InfluxDB v2.0
Since we already have
dockeron our host machine, let us setup the TSDB on it.$ docker run --name=influxdbV2 -p 8086:8086 influxdb:2.0.7This should be able to run InfluxDB v2.0.7 on the host machine and the port
8086should be available for the TSDB to ingest any incoming metrics sent to it.Open a browser and visit http://localhost:8086 which will provide you the UI for InfluxDB v2. Click on Get Started
Let’s setup our InfluxDB v2 with the following information:
Username:
edenPassword:influxdbOrganization:LF-EDGEBucket Name:eve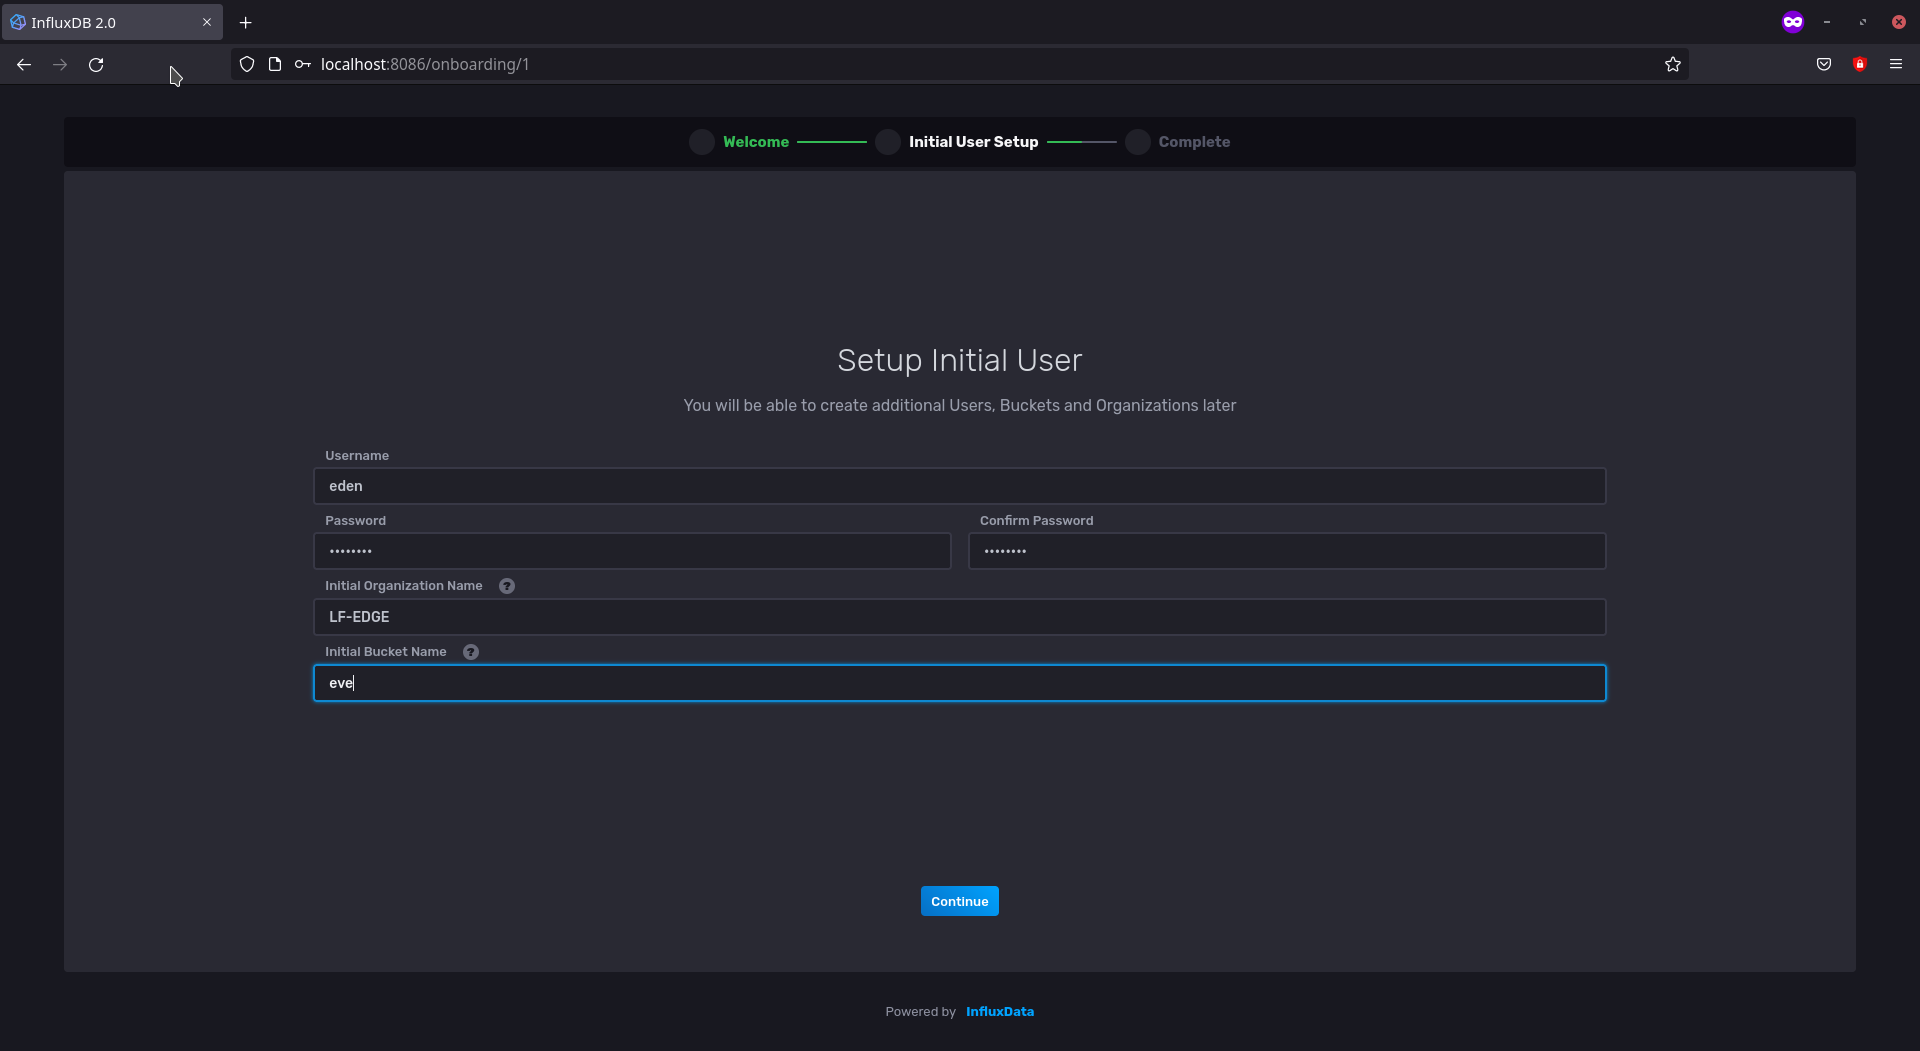
InfluxDB v2 Initial Configuration UI
Click Continue
Click on Configure Later for the next step. We have now configured our InfluxDB v2 with a user
edenunder the OrganizationLF-EDGEand a bucket calledeveto store any metrics dedicated for it.
Telegraf
telegraf requires a configuration file in TOML to be able to acquire and push
information to our TSDB. It provides a wide range of plugins but for this tutorial
we will focus on the easiest ones.
The eden/data/telegraf/telegraf.conf file for our case looks like the following:
[agent]
    interval = "2s"
    round_interval = true
    metric_batch_size = 1000
    metric_buffer_limit = 10000
    collection_jitter = "0s"
    flush_interval = "10s"
    flush_jitter = "0s"
    precision = ""
    debug = true
    quiet = false
    hostname = "EVE-QEMU-1" # change according to your needs
    omit_hostname = false

### INPUT PLUGINS ###
[[inputs.cpu]]

[[inputs.mem]]

### OUTPUT PLUGINS ###

[[outputs.influxdb_v2]]

  # REMEMBER TO CHANGE INPUTS HERE BEFORE DEPLOYMENT

  urls = ["http://YOUR_IP_ADDRESS:8086"]

  token = "YOUR_INFLUXDBV2_GENERATED_TOKEN_HERE"

  organization = "LF-EDGE"
  bucket = "eve"
Adapt the Configuration file where the urls should point to the host’s IP Address.
For an InfluxDB v2 Token we do the following:
Head to Data in our InfluxDB UI on the left-side column
We click on the Tokens Header in the UI where you will see the following:
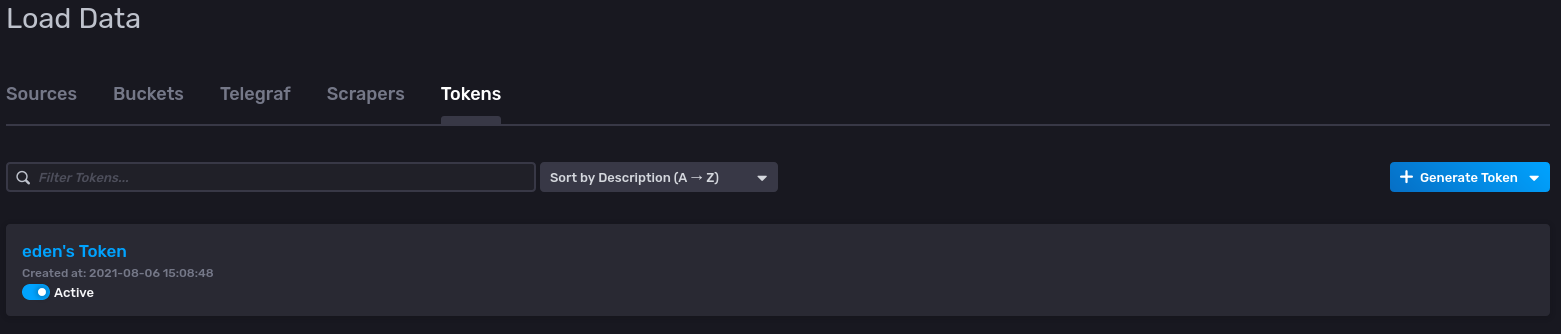
Generated Token for user eden in InfluxDBV2 UI
Click on
eden's Tokenand copy the token into the configuration file for the output plugin
We are done with telegraf configuration! we will let eden download telegraf's
docker image from Docker Hub for us.
Eden Setup
In our eden repository’s root directory:
Source our environment variables for
eden$ source ~/.eden/activate.shStart
eden$ ./eden startLet’s check if our EVE device is connected to
edenusing:$ ./eden status
This should be able to provide all the necessary status checks between eden and eve
Application Deployment
Like we previously deployed our nginx pod we will deploy our telegraf pod using:
$ ./eden pod deploy --name=eve_telegraf docker://telegraf --mount=src=./data/telegraf,dst=/etc/telegraf/
This should be able to start downloading the telegraf pod and begin with the deployment process:
INFO[0003] deploy pod eve_telegraf with docker://telegraf request sent
You check that status of your pods using
$ ./eden pod ps
NAME		 IMAGE			            UUID					            INTERNAL	EXTERNAL  MEMORY	STATE(ADAM)	LAST_STATE(EVE)
eve_telegraf library/telegraf:latest	af903ac5-c464-470d-adfc-1ee75b467d03	-		-	      0 B/0 B	IN_CONFIG	DOWNLOAD_STARTED (19%)
After a few minutes the Status should RUNNING
$ ./eden pod ps
NAME		 IMAGE			            UUID					                INTERNAL	EXTERNAL	MEMORY		STATE(ADAM)	LAST_STATE(EVE)
eve_telegraf library/telegraf:latest	af903ac5-c464-470d-adfc-1ee75b467d03	10.11.12.2	-		    0 B/1.6 GB	IN_CONFIG	RUNNING
Debugging and Logs
To check the logs of running pod, here eve_telegraf we can do the following:
$ ./eden pod logs eve_telegraf
If you need the logs in a different format use:
$ ./eden pod logs eve_telegraf --format=json
This should be able to provide you a detailed log of deployed pod’s behavior
Dashboard
Head to the InfluxDB UI and click on Explore on the left-side column where you will be able to
see eve bucket
Click on the eve bucket and select the measurements accordingly.
Outputs
CPU Utilization of the emulated EVE device
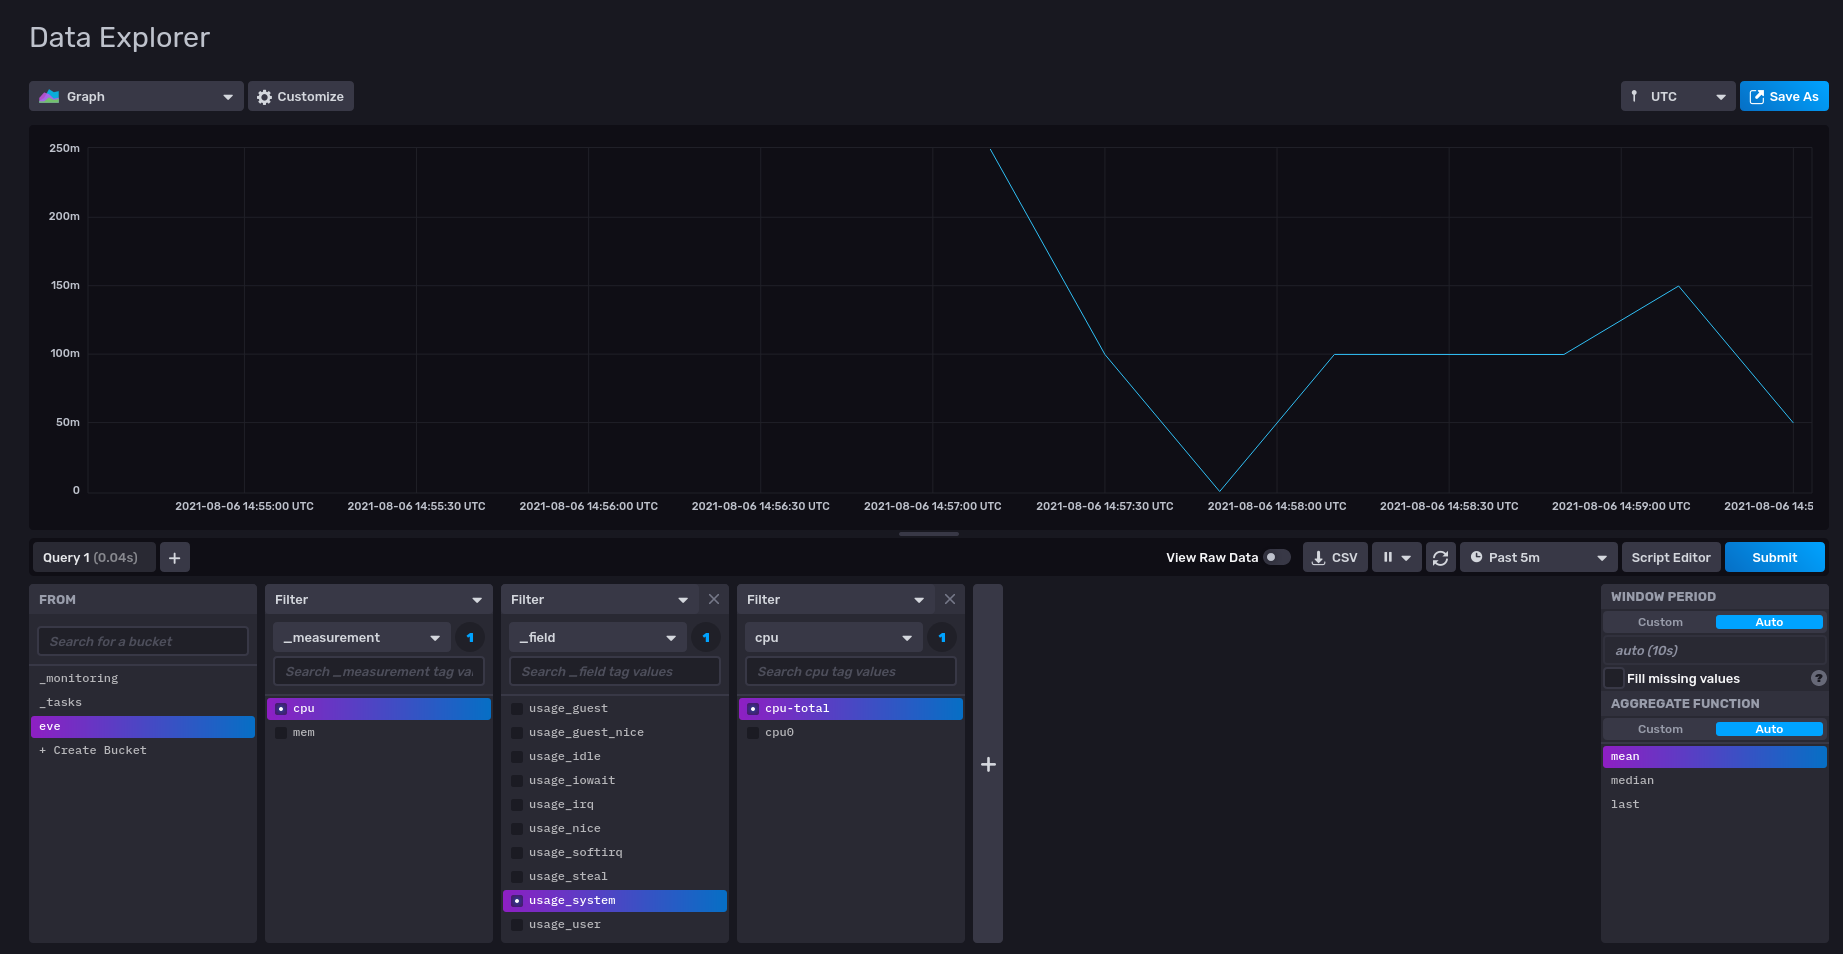
InfluxDB UI Exploration of CPU Utilization of Emulated EVE Device in QEMU
Memory Usage of the emulated EVE device
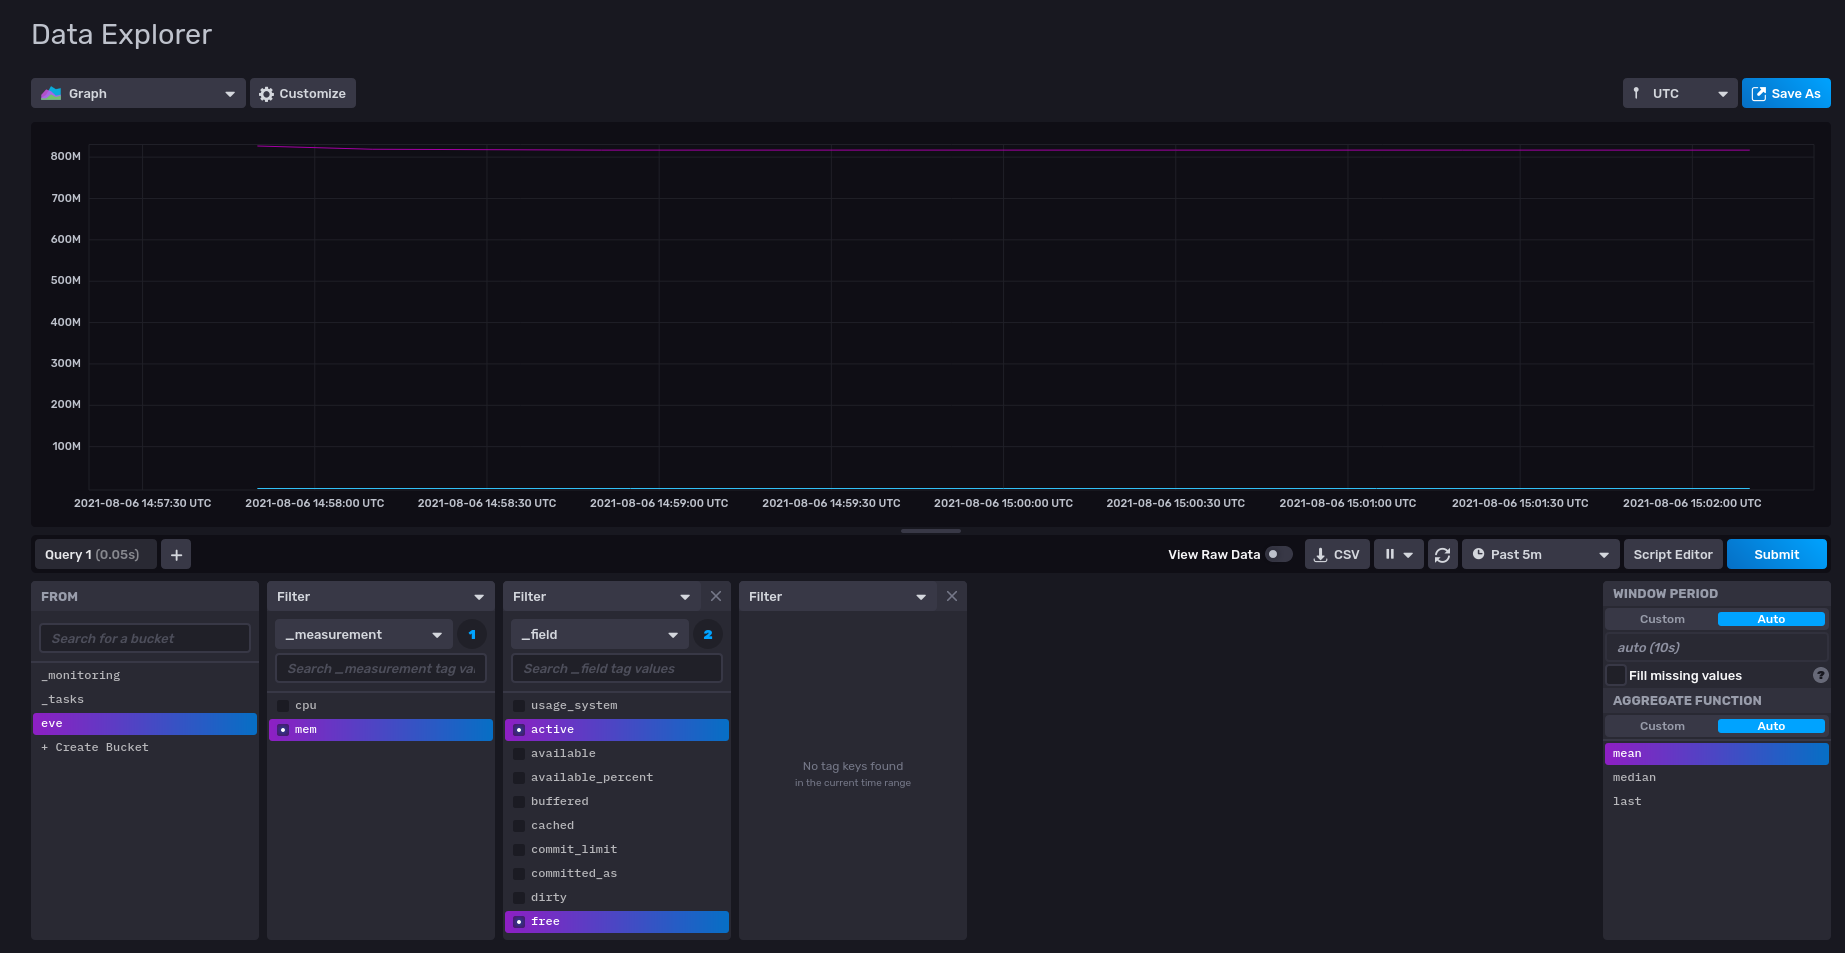
InfluxDB UI Exploration of Memory Utilization of Emulated EVE Device in QEMU
Clean Up
You can stop the pod using the name of the pod
$ ./eden pod stop eve_telegrafYou can delete the pod after stopping it as follows:
$ ./eden pod delete eve_telegrafStop
edenusing:$ ./eden stop